Friday, July 30, 2010

Unstandardized Choropleth Map


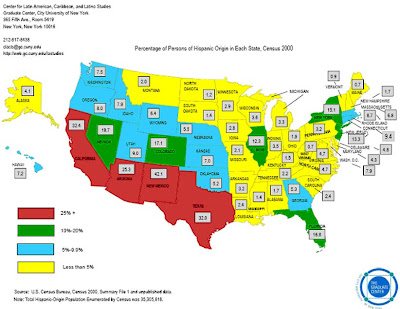
Unstandardized choropleth maps do not have any specific order. There are basically no rules like the other choropleth maps. The map above is not as organized as other maps.There is no specific ranking of the variables. The map represents the number of United States citizens with Spanish roots. You not tell which areas are the highest by just simply looking at the map.

Source:http://www.sitemaker.umich.edu/356.

Isotach Maps


Isotach maps are used to analyze lines of equal
wind speed on a constant pressure surface of 300 mb or 250 mb. The maps shows where the jet stream is located. The Isotach above was
issued by the National Centers for Environmental Prediction. It is a medium range forecast of 200 mb streamlines and isotachs.

Infrared Aerial Photo


Infrared aerial photos are used to display changes to the environment, forests, wetlands, bays and oceans and it can also be used to document and monitor such items as damage to roofs, insect activity, disease infested land, sites contaminated by toxic chemical, oil spills, and more. The image above is an infrared aerial photo of the mouth of the Parker River.

Isopach Map

Isopach maps illustrate variation of thickness within a stratigraphic unit. The isopachs are contour lines of equal thickness over an area.The map above shows the thickness and areal extent of Silurian evaporite basins in the Great Lakes area.

Standardized Choropleth Maps


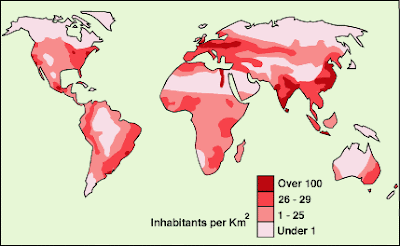
Standardized choropleth maps are standardized to show comparisons of
distribution among different areas. The above map is a standardized choropleth map of the United States Population Density.

Thursday, July 29, 2010

Nominal Area Choropleth Map

Nominal area choropleth map are used to display nominal (numerical) data. The map above show the Hispanic population in the United States. The data tells you that there are more Hispanics living in the western part of the United States.

Correlation Matrix


Correlation matrix shows the covariances between elements of a random vectors. The correlation above is based on research about the relationship between proteins and virus. The correlated behavior ranges from high represented in red and low, represented in blue.
Source: http://yin.che.wisc.edu/images.htm